
The post The Dividend Aristocrats 2026: A Must Read Guide appeared first on Dividend Power.
The Dividend Aristocrats 2026 are U.S. stocks that have increased their dividend for 25+ years. However, this factor alone does not qualify a stock as a Dividend Aristocrat. To be included on the list, a company must meet five criteria.
Be a member of the S&P 500 Index
Have raised the regular dividend per share for at least 25 consecutive years
Have a market capitalization of at least $3 billion
Average at least $5 million in daily share trading value for the three months before the rebalancing date
The minimum number of constituents must be 40 at each rebalancing date. In addition, a particular Global Industry Classification Standard or ‘GICS’ should only result in one sector comprising up to 30% of the index weight.
The Index is updated quarterly in January, April, July, and October.
These stocks are found in the S&P 500 Dividend Aristocrats Index. Currently, there are 69 stocks in the Dividend Aristocrats.
Investors can examine updated, select financial data and the dividend earnings calendar for each stock in the Dividend Aristocrats list in the tables at the end of the article. The most recent dividend increases are also available to search.
Market Update for the Dividend Aristocrats 2026
The Dividend Aristocrats 2026 yields about 2.64%, and the average forward price-to-earnings ratio is approximately 17.75X. The trailing P/E ratio is 25.24X.
The mean market capitalization is roughly $110,280 million, and the median is approximately $40,851 million. The market cap ranges between about $7,413 million and $990,532 million. The total market capitalization is roughly $7,609,835 million.
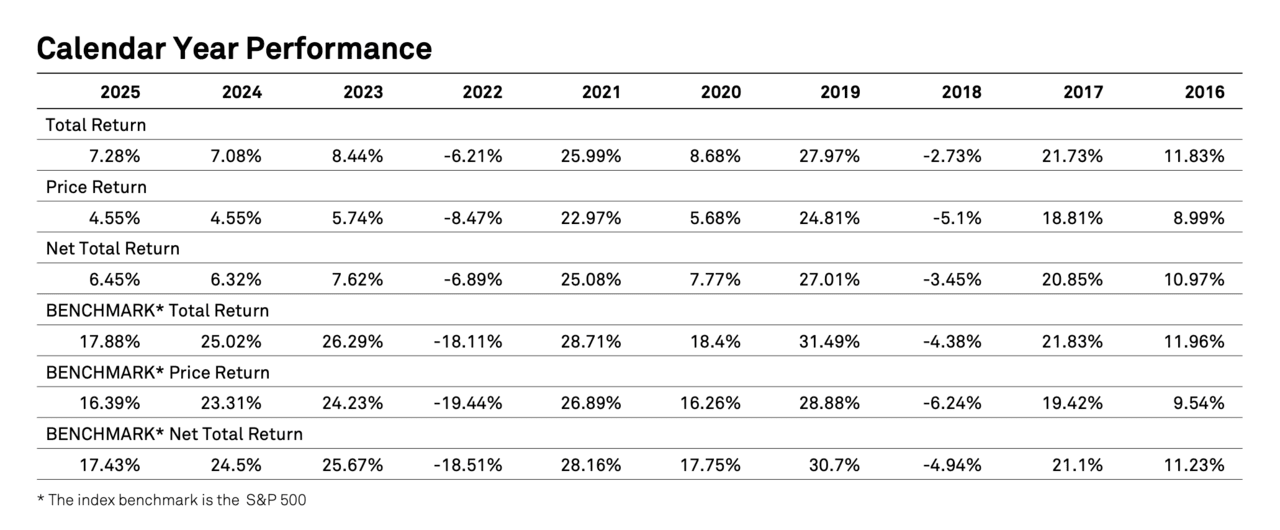
In 2025, the Dividend Aristocrats provided a total return of 7.28% after a similar positive return in 2024. The price return was 4.55%. This performance was less than the S&P 500 Index in 2025 at 17.88%.
In the trailing 1-year, the Dividend Aristocrats 2026 returned +13.9% (blue line) compared to +26.4% for the S&P 500 Index (red line), as seen in the chart below. We used Stock Rover* to create this watchlist and chart. Over the trailing 5-years, the Dividend Aristocrats have returned +48.5%, and the S&P 500 Index has returned +78.2%.
Source: Stock Rover
Difference Between Dividend Champions and Aristocrats
A Dividend Aristocrat can also be a Dividend Champion but not vice-versa. For instance, Arrow Financial Corporation (AROW) does not meet all the above criteria; thus, it is not a Dividend Aristocrat. However, Arrow has raised the dividend for 31 years, permitting it to be on the Dividend Champions list. As a result, there are more Dividend Champions than Dividend Aristocrats.
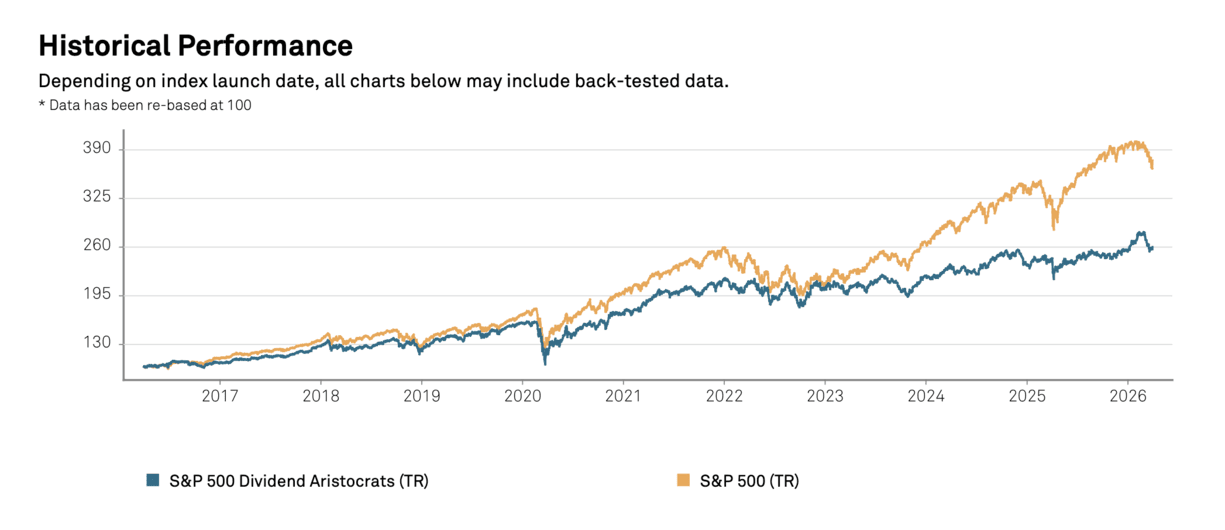
Historical Performance
As a group, the S&P 500 Dividend Aristocrats have exhibited solid returns with low volatility. For example, the Dividend Aristocrats had annualized total returns of 10.03% over the past decade and a standard deviation of 14.95%. On the other hand, the benchmark (the S&P 500 Index) had annualized total returns of 14.16% and a standard deviation of 15.02%. However, since the pandemic, the mega cap technology stocks have outperformed the Dividend Aristocrats by a large margin resulting in this discrepancy.
Over the past 5-years, the Dividend Aristocrats had an annualized total return of 6.8% with a standard deviation of 15.28%. The benchmark had an annualized total return of 12.06% and a standard deviation of 15.26%.
The table below shows the calendar year’s performance from 2016 to 2025.
Changes to the Dividend Aristocrats in 2026
No changes occurred at the start of the year to the constituents of the list.
Other Dividend Stock Lists
Note that a company can be a Dividend Aristocrat and a Dividend King. Dividend Kings have raised dividends for at least 50 consecutive years. The other lists of American stocks are below.
List of Dividend Kings in 2026
List of Dividend Champions in 2026
List of Dividend Contenders in 2025
List of Dividend Challengers in 2025
For Canadian stocks, there is an article
Canadian Dividend Aristocrats in 2026
For UK stocks, there is an article
UK High Yield Dividend Aristocrats in 2025
Other dividend stock lists
American Stocks Paying 100+ Years of Dividends
Canadian Stocks Paying 100+ Years of Dividends
Some Details on the Dividend Aristocrats 2026
The Dividend Aristocrats 2026 is a reasonably select list since there are only 69 companies. This number is out of nearly 6,000 companies listed on the New York Stock Exchange (NYSE) and NASDAQ in 2026, indicating a success rate of approximately 1.2%.
Dividend Aristocrats Sector Breakdown
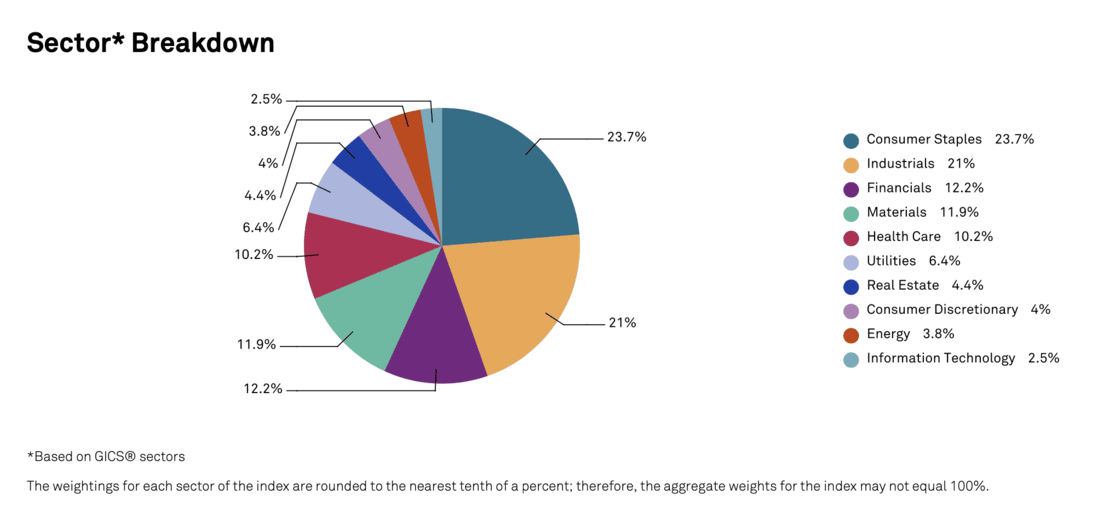
The sector with the highest representation of the Dividend Aristocrats 2026 is Consumer Staples, approximately 23.7%. This point is likely due to these stocks’ relatively stable earnings and cash flow characteristics. In addition, these companies tend to grow profits slowly over time, permitting annual dividend increases.
Stocks from the Industrials sector have the second-highest representation on the Dividend Aristocrats 2026 at about 21%. This class of stocks tends to have more volatile earnings and cash flows, but many have low payout ratios, allowing them to grow their dividends during recessions and economic downturns.
The third sector on the list is the Financials sector at 12.2%. These firms are able to raise their dividends because of sound balance sheets and growing top and bottom lines.
These three sectors comprise the majority of the Dividend Aristocrats at 56.9%.
Only Three REITs
Only three Real Estate Investment Trusts (REITs) exist in the Dividend Aristocrats. These are Essex Property Trust (ESS), Federal Realty Investment Trust (FRT), and Realty Income (O). In addition, the list does not include any Master Limited Partnerships (MLPs).
Related Articles About REITs on Dividend Power
Federal Realty (FRT): A Dividend King REIT
Essex Property Trust (ESS): Undervalued REIT
Sector Breakdown
The sector breakdown for the Dividend Aristocrats 2026 is seen in the chart below. Because of the composition changes in the S&P 500 Index, the sector composition has changed with time. In addition, the Great Recession caused many previous Dividend Aristocrats to freeze or even cut their dividends. As a result, these primarily financial stocks were dropped from the list of Dividend Aristocrats, affecting the sector composition.
A few industrial stocks were also dropped from the list at the time. In fact, between 2009 and 2010, nineteen companies were dropped from the list of Dividend Aristocrats.
The sector ranking for the Dividend Aristocrats 2026 is unlike the Canadian Dividend Aristocrats, which have Financials, Industrials, and Real Estate as the top three sectors.
It is also unlike the UK High Yield Dividend Aristocrats, with Financials, Real Estate, and Industrials as the top three sectors.
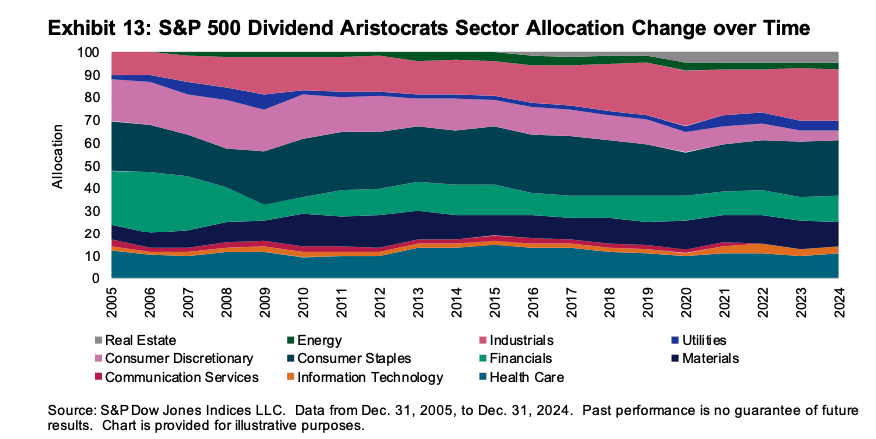
Sector Allocation History
The chart below shows the sector allocation over time. Consumer Staples has consistently maintained its lead over time. The sector allocation changes because of economic events.
For example, the Great Recession caused many previous Dividend Aristocrats to freeze or even cut their dividends. As a result, these primarily financial stocks were dropped from the list of Dividend Aristocrats, affecting the sector composition. A few industrial stocks were also dropped from the list at the time. In fact, between 2009 and 2010, nineteen companies were dropped from the list of Dividend Aristocrats. More recently, some additional industrial and retail firms were removed because of dividend cuts during the COVID-19 pandemic and because of divestments.
Market Size of the S&P 500 Dividend Aristocrats 2026
The largest Dividend Aristocrat by market capitalization is Walmart (WMT), with roughly $1,010 billion market capitalization. The smallest Dividend Aristocrat is Factset Data & Stock Exchanges (FDS), with a $7.708 billion market capitalization. The Dividend Aristocrats have a total market capitalization of over $6 trillion.
The one with the highest forward yield is Amcor (AMCR), and the one with the lowest dividend yield is West Pharmaceuticals (WST).
Dover Corporation (DOV) is the Dividend Aristocrat with the longest streak of consecutively increasing the dividend at 70 years. It is followed by Genuine Parts Company (GPC), Northwest Natural Holding Company (NWN), and The Procter & Gamble Company (PG)
List of Dividend Aristocrat Stocks in 2026
The Dividend Aristocrat 2026 list serves as a screen for further investigating a stock for a dividend growth portfolio. It is a list of companies with stable businesses that have competitive advantages and have returned cash to shareowners consistently through dividends and, in some cases, buybacks.
Stock Rover* was used to create this table.
TickerCompanyFwd. YieldEPS 5-Year Avg (%)Dividend 10-Year Avg (%)Payout RatioForward P/EMarket Cap ($M USD)
ABBVAbbVie3.30%-2.50%11.70%276.80%12.9$367,796
ABTAbbott Laboratories2.50%3.10%9.30%63.30%16.4$174,288
ADMArcher-Daniels-Midland3.00%-9.50%5.70%91.50%14.4$33,602
ADPAutomatic Data Processing3.60%12.60%12.40%60.50%15.8$76,015
AFLAflac2.20%-2.50%11.50%33.90%14.3$57,030
ALBAlbemarle0.90%- 2.90%- 20.1$20,469
AMCRAmcor6.30%-13.60%- 192.00%9.4$19,017
AOSA.O. Smith2.10%9.90%11.60%35.70%15.2$9,112
APDAir Products2.40%- 7.70%- 21.3$66,509
ATOAtmos Energy2.10%7.00%9.10%46.50%21.6$31,492
BDXBecton Dickinson2.70%1.80%4.80%68.10%11.4$43,870
BENFranklin Resources5.30%-12.90%6.20%119.40%8.7$12,972
BF.BBrown-Forman3.10%-2.00%5.40%52.90%17.4$13,551
BROBrown & Brown1.00%11.30%10.40%18.30%13.1$22,098
CAHCardinal Health1.00%12.20%2.80%29.20%18.6$50,715
CATCaterpillar0.80%24.60%7.00%30.90%28.5$367,884
CBChubb1.20%15.80%3.80%14.70%11.3$127,389
CHDChurch & Dwight Co1.30%-0.40%5.60%38.80%23.8$22,602
CHRWC.H. Robinson Worldwide1.50%1.70%3.90%51.00%22.9$19,267
CINFCincinnati Financial2.20%-4.30%7.00%22.70%17.5$25,087
CLColgate-Palmolive2.50%-3.30%3.20%78.00%20.5$67,666
CLXClorox4.70%-3.20%4.90%80.10%15.7$12,729
CTASCintas1.00%15.70%18.40%36.20%32.3$69,987
CVXChevron3.80%- 5.20%102.90%18.5$375,572
DOVDover1.00%9.30%2.20%25.90%18.9$29,267
ECLEcolab1.00%19.10%7.60%36.60%28.3$77,183
EDConsolidated Edison3.00%10.80%2.90%60.10%17.5$41,837
EMREmerson Electric1.50%2.90%1.60%52.00%20.1$80,798
ERIEErie Indemnity2.30%12.60%7.20%46.30%- $13,345
ESEversource Energy4.50%4.80%5.90%66.00%13.7$26,297
ESSEssex Property Trust4.10%9.80%4.90%98.90%40.7$16,123
EXPDExpeditors International1.10%3.40%7.90%25.80%21.9$19,024
FASTFastenal1.80%7.60%12.30%79.60%36.2$56,463
FDSFactSet Research Systems2.10%9.10%9.60%28.10%10.9$7,708
FRTFederal Realty Investment4.10%25.20%1.90%95.30%34.3$9,420
GDGeneral Dynamics1.80%6.90%7.70%38.30%18.6$90,773
GPCGenuine Parts4.00%-23.40%4.90%876.60%12.6$14,957
GWWW.W. Grainger0.80%20.20%6.80%24.90%24.1$55,474
HRLHormel Foods5.70%-11.30%7.30%130.60%13.1$11,323
IBMIBM2.90%13.60%2.60%59.10%17.2$216,547
ITWIllinois Tool Works2.40%8.50%11.30%59.10%22.3$77,930
JNJJohnson & Johnson2.20%14.30%5.70%46.20%19$574,357
KMBKimberly-Clark5.30%-6.10%3.40%82.80%12.7$32,289
KOCoca-Cola2.70%12.70%4.20%66.90%22.4$333,442
KVUEKenvue4.80%- – 108.60%14.3$33,255
LINLinde1.30%21.60%7.90%40.80%25.8$233,156
LOWLowe’s Companies2.00%8.90%15.70%40.00%17.9$136,778
MCDMcDonald’s2.40%11.60%7.60%59.80%21.3$217,285
MDTMedtronic3.30%10.90%6.50%78.60%14.4$111,967
MKCMcCormick & Co3.60%16.50%8.40%29.90%16.1$14,444
NDSNNordson1.20%14.50%13.10%34.50%22.2$15,356
NEENextEra Energy2.70%9.30%11.10%68.50%21.5$196,185
NUENucor1.20%6.90%4.10%29.40%13.9$42,386
ORealty Income5.10%4.00%3.10%275.50%36.3$59,443
PEPPepsiCo3.60%2.10%7.30%93.40%17.2$214,691
PGProcter & Gamble2.90%4.40%4.80%60.50%19.9$337,351
PNRPentair1.20%9.60%-2.00%25.10%15.5$14,578
PPGPPG Indus2.60%6.70%7.00%39.90%12.9$24,691
ROPRoper Technologies1.10%8.50%11.70%23.10%14.7$35,129
SHWSherwin-Williams1.00%5.80%11.10%30.50%25.1$83,140
SJMJM Smucker4.80%- 5.10%- 11.2$9,695
SPGIS&P Global0.90%7.60%10.40%26.20%18.8$122,955
SWKStanley Black & Decker4.60%-23.10%4.20%124.10%11.4$11,210
SYYSysco3.00%- 5.70%57.10%14.5$34,820
TGTTarget3.70%-1.20%7.40%55.40%14.3$55,198
TROWT. Rowe Price Group5.70%-4.70%9.20%54.90%9.3$19,908
WMTWalmart0.80%11.50%4.00%34.30%38.6$1,010,661
WSTWest Pharmaceutical Servs0.30%4.00%6.20%12.50%28.9$18,492
XOMExxon Mobil2.70%- 3.50%59.70%16$633,916
Dividend Calendar
This table was created using StockRover*.
TickerCompanyEx-Div. DateDiv. Record DateDiv. Payment DateDividend FrequencyNext Div. Payment Per ShareFwd. Div. Per Share
WSTWest Pharmaceutical Servs4/29/264/29/265/6/264$0.22 $0.88
CATCaterpillar4/20/264/20/265/19/264$1.51 $6.04
GWWW.W. Grainger2/9/262/9/263/1/264$2.26 $9.04
WMTWalmart5/8/265/8/265/26/264$0.25 $0.99
ALBAlbemarle3/13/263/13/264/1/264$0.41 $1.62
SPGIS&P Global2/25/262/25/263/11/264$0.97 $3.88
CAHCardinal Health4/1/264/1/264/15/264$0.51 $2.04
SHWSherwin-Williams3/2/263/2/263/13/264$0.80 $3.20
DOVDover2/27/262/27/263/13/264$0.52 $2.08
BROBrown & Brown2/4/262/4/262/11/264$0.17 $0.63
ECLEcolab3/17/263/17/264/15/264$0.73 $2.76
CTASCintas2/13/262/13/263/13/264$0.45 $1.80
ROPRoper Technologies4/6/264/6/264/22/264$0.91 $3.64
EXPDExpeditors International12/1/2512/1/2512/15/252$0.77 $1.54
PNRPentair4/17/264/17/265/1/264$0.27 $1.04
CBChubb3/13/263/13/264/6/264$0.97 $3.88
NDSNNordson3/19/263/19/264/3/264$0.82 $3.28
NUENucor3/31/263/31/265/11/264$0.56 $2.24
LINLinde3/11/263/11/263/26/264$1.60 $6.40
CHDChurch & Dwight Co2/13/262/13/263/2/264$0.31 $1.23
CHRWC.H. Robinson Worldwide3/6/263/6/264/2/264$0.63 $2.52
EMREmerson Electric2/13/262/13/263/10/264$0.56 $2.22
GDGeneral Dynamics4/10/264/10/265/8/264$1.59 $6.09
FASTFastenal1/29/261/29/262/26/264$0.24 $0.90
LOWLowe’s Companies4/22/264/22/265/6/264$1.20 $4.80
FDSFactSet Research Systems2/27/262/27/263/19/264$1.10 $4.40
ATOAtmos Energy2/23/262/23/263/9/264$1.00 $4.00
AOSA.O. Smith1/30/261/30/262/17/264$0.36 $1.40
JNJJohnson & Johnson2/24/262/24/263/10/264$1.30 $5.20
AFLAflac2/18/262/18/263/2/264$0.61 $2.44
CINFCincinnati Financial3/24/263/24/264/15/264$0.94 $3.55
ERIEErie Indemnity4/7/264/7/264/21/264$1.46 $5.85
ITWIllinois Tool Works3/31/263/31/264/9/264$1.61 $6.44
APDAir Products4/1/264/1/265/11/264$1.81 $7.24
MCDMcDonald’s3/3/263/3/263/17/264$1.86 $7.44
ABTAbbott Laboratories4/15/264/15/265/15/264$0.63 $2.52
CLColgate-Palmolive4/20/264/20/265/15/264$0.53 $2.12
PPGPPG Indus2/20/262/20/263/12/264$0.71 $2.84
NEENextEra Energy2/27/262/27/263/16/264$0.62 $2.49
KOCoca-Cola3/13/263/13/264/1/264$0.53 $2.06
XOMExxon Mobil2/12/262/12/263/10/264$1.03 $4.12
BDXBecton Dickinson3/10/263/10/263/31/264$1.05 $4.20
IBMIBM2/10/262/10/263/10/264$1.68 $6.72
PGProcter & Gamble1/23/261/23/262/17/264$1.06 $4.23
SYYSysco4/2/264/2/264/24/264$0.54 $2.16
ADMArcher-Daniels-Midland2/17/262/17/263/10/264$0.52 $2.08
EDConsolidated Edison2/18/262/18/263/16/264$0.89 $3.44
BF.BBrown-Forman3/9/263/9/264/1/264$0.23 $0.92
MDTMedtronic3/27/263/27/264/17/264$0.71 $2.84
ABBVAbbVie4/15/264/15/265/15/264$1.73 $6.92
MKCMcCormick & Co4/20/264/20/264/27/264$0.48 $1.92
ADPAutomatic Data Processing6/12/266/12/267/1/264$1.70 $6.80
PEPPepsiCo3/6/263/6/263/31/264$1.42 $5.69
TGTTarget5/13/265/13/266/1/264$1.14 $4.56
CVXChevron2/17/262/17/263/10/264$1.78 $7.12
GPCGenuine Parts3/6/263/6/264/2/264$1.06 $4.25
ESSEssex Property Trust3/31/263/31/264/15/264$2.59 $10.30
FRTFederal Realty Investment4/1/264/1/264/15/264$1.13 $4.49
ESEversource Energy3/5/263/5/263/31/264$0.79 $3.15
SWKStanley Black & Decker3/10/263/10/263/24/264$0.83 $3.32
CLXClorox4/22/264/22/265/8/264$1.24 $4.96
KVUEKenvue2/11/262/11/262/25/264$0.21 $0.83
SJMJM Smucker2/13/262/13/263/2/264$1.10 $4.40
ORealty Income3/31/263/31/264/15/2612$0.27 $3.23
KMBKimberly-Clark3/6/263/6/264/2/264$1.28 $5.12
BENFranklin Resources3/31/263/31/264/10/264$0.33 $1.32
TROWT. Rowe Price Group3/16/263/16/263/30/264$1.30 $5.20
HRLHormel Foods4/13/264/13/265/15/264$0.29 $1.17
AMCRAmcor2/25/262/25/263/17/264$0.65 $2.60
Prior Year Lists and Articles
The List of Dividend Aristocrats 2025
The List of Dividend Aristocrats 2024
The List of Dividend Aristocrats 2023
The List of Dividend Aristocrats 2022
The List of Dividend Aristocrats 2021
The List of Dividend Aristocrats in 2020
The post The Dividend Aristocrats 2026: A Must Read Guide appeared first on Dividend Power.